
State Plan for Logistics and Transportation of Minas Gerais
Short-Term Plan
The Short-Term PELTMG focuses on identifying and prioritising immediate actions that meet the main demands of the population and stimulate the state’s economic activities. This document presents the results of these analyses, translating them into practical guidelines to facilitate the implementation of strategic interventions and the alignment of state actions with regional and sectoral needs.
Location
Minas Gerais, Brazil
Timeline
18 months
Project Team
Leandro Silva, Maíra Freitas, Felipe Almeida, Bianca Gonçalves, Gabriel Toscano
Role
Strategic Freight and Passenger Corridors; Data Visualisation
Date Completed
July 2025
Language and Packages
SQL, LaTEX, Python, Pandas, Geopandas, Numpy, Matplotlib, Fiona, and Seaborn
Key findings
- The project portfolio analysis totals $177 bn, comprising $93 bn in CAPEX and $84 bn in OPEX.
- The analysis portfolio includes 1,582 projects, approximately 90% of which are road-related.
- The state-level portfolio comprises 418 projects (86%), totaling $19 bn in investments.
- 94% of Minas Gerais municipalities are covered by the PELTMG analysis portfolio.
- The Short-Term Portfolio anticipates $48 bn in new investments, distributed across 488 projects (roads, railways, airports, waterways, and pipelines).
- 73 logistical corridors are included in the PELTMG analysis
- 84% of the recommended portfolio projects are privately funded, while 16% are public investments.
- $22 bn in investments are expected to be allocated by 2026 under the Short-Term Portfolio results.
- $26 bn in investments will be monitored until 2055 under the Short-Term Portfolio results.
- Significant impacts: $249 bn in social, economic, and environmental benefits are expected from the investments.
Methodological Differentials
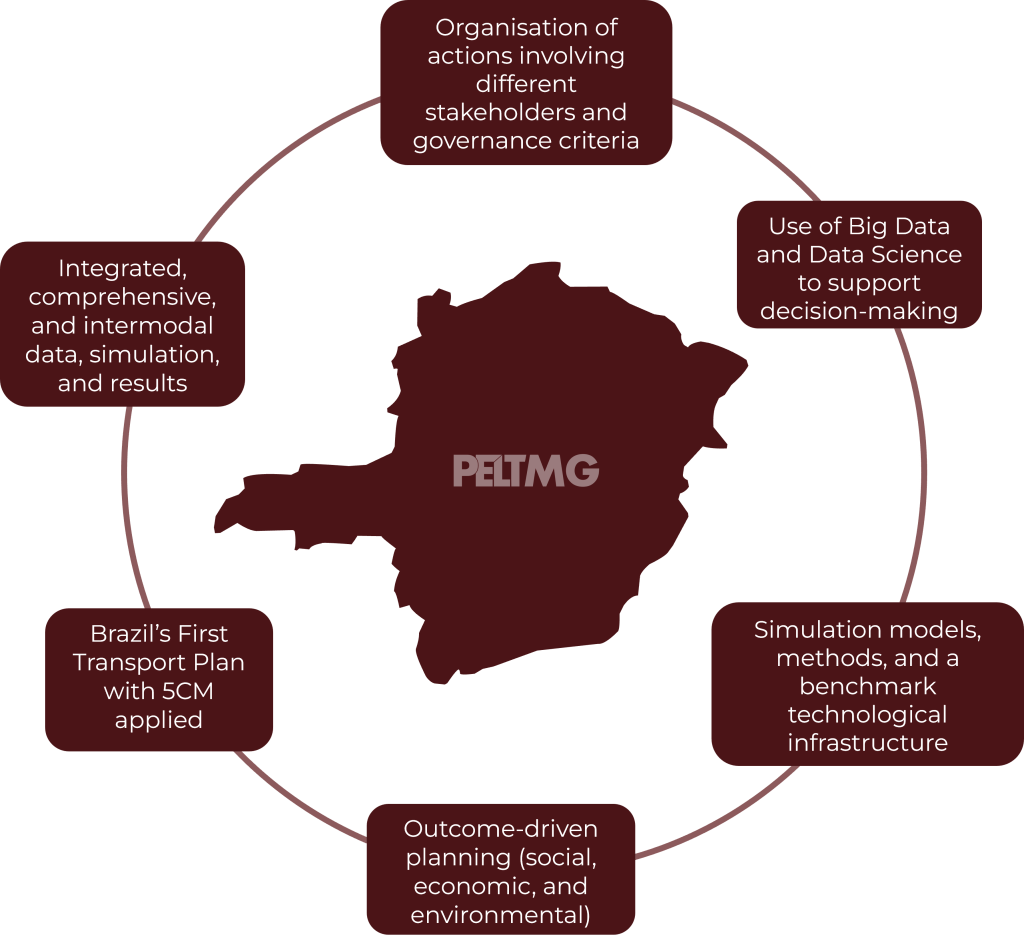
The Short-Term PELTMG incorporates several methodological innovations, as illustrated in the figure above, to improve the efficiency and effectiveness of transport planning and execution. It uses planning as a tool to assess social, economic, and environmental aspects and to recommend a set of actions. Various indicators were employed to diagnose and assess the individual impacts of portfolio projects in order to achieve the plan’s objectives.
The PELTMG is a pioneer in Brazil in applying the Five Case Model for transport planning, a methodology developed by the UK Treasury. This approach ensures that the actions proposed by the plan are structured and aligned with the State’s strategy, maximising societal benefits, ensuring financial viability and market attractiveness, and confirming the feasibility of implementation.
To process the data and generate strategic insights, technology parks as well as state-of-the-art software are involved, with the entire process structured around integrated databases.
Five Case Model Applied to Transport Planning
The Five Case Model is composed of the following cases: Strategic Case (1), Socioeconomic Case (2), Financial Case (3), Commercial Case (4), and Management Case (5). Each of these cases is detailed in figure below. The scope of activities encompassed by the Strategic, Socioeconomic, and Financial Cases is traditionally applied in transport planning. These cases aim to demonstrate alignment with the State’s strategic policies, as well as the delivery of social, economic, and environmental benefits, and financial feasibility.
Within the Strategic Case, strategic alignment is evaluated through a comprehensive review of current legislation related to policies that support the development of key economic sectors in the state of Minas Gerais. This analysis served as the foundation for identifying the State’s strategic freight corridors. In addition, for passenger transport, the main interurban mobility corridors were identified based on the hierarchical structure of the Brazilian urban network, as defined in the 2018 Regions of Influence of Cities (REGIC) report published by the Brazilian Institute of Geography and Statistics (IBGE).
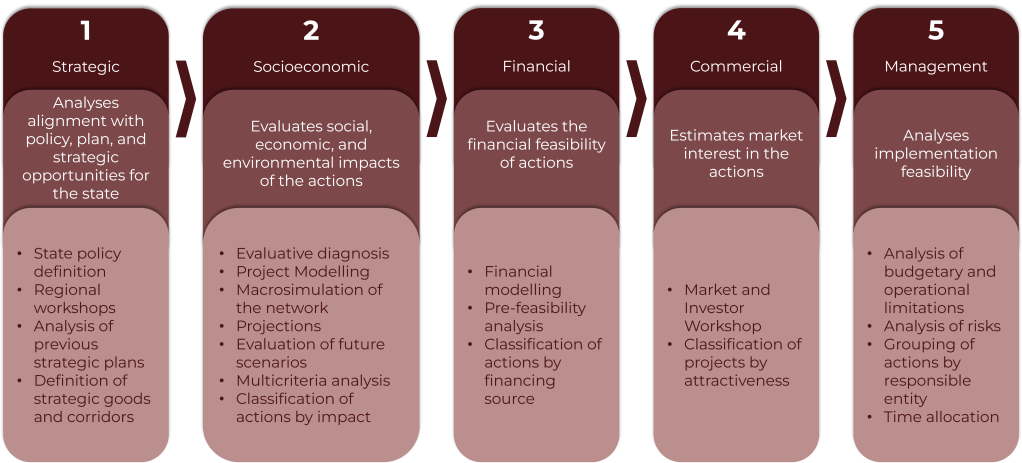
The socioeconomic benefits of implementing subsequent phases are detailed within the Socioeconomic Case, as this is the stage in which both the baseline scenario diagnosis and the projection of future scenarios are conducted (the latter to be included in the Long-Term PELT). These analyses are based on a series of indicators that assess the performance of the state of Minas Gerais in relation to the objectives established in the State Policy for Logistics and Transportation. The financial feasibility of the proposed actions is analysed within the Financial Case. Based on primary feasibility studies of the projects in the analysis portfolio, those with the highest potential to be structured as concessions or public-private partnerships (PPPs) are identified, while also highlighting projects to be executed through public management.
The contribution of the Five Case Model to transport planning lies primarily in the inclusion of the Commercial and Management Cases in the plan’s development process. The Commercial Case captures the level of market interest in the portfolio from potential investors and financiers prior to finalising the portfolio. In the Management Case, the feasibility of implementing actions by their probable responsible entities is assessed. Additionally, potential institutional, environmental, and legal risks are evaluated, along with limiting factors such as technical and operational capacity, budgetary constraints, and temporal resource allocation. At this stage, the portfolio is subdivided by probable responsible entities within the State Government based on the results of the prioritisation process.
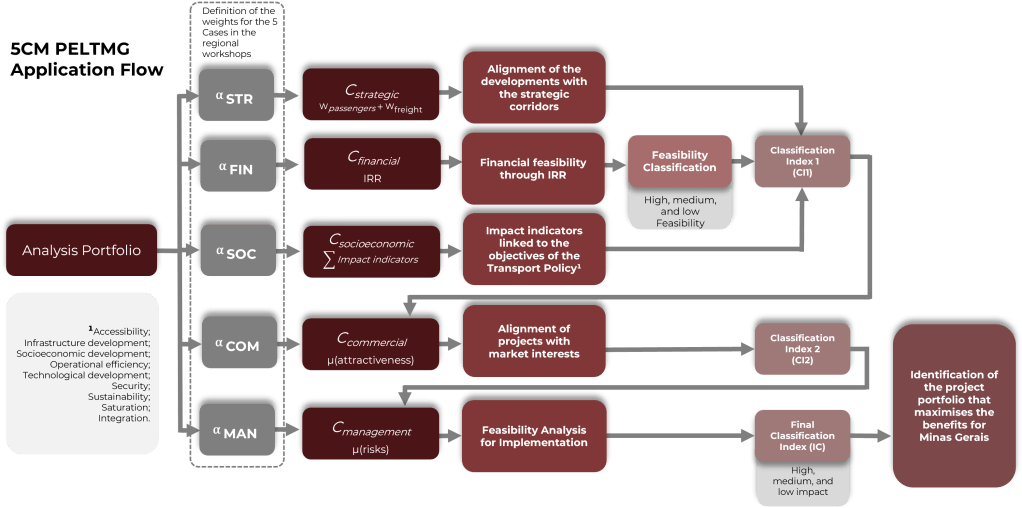
The results of the Short-Term PELTMG aim to objectively quantify the potential social, economic, and environmental outcomes of implementing the proposed actions, thereby guiding the organisation and prioritisation of the project portfolio. For this purpose, indices representing each of the Five Cases are considered as explanatory variables.
The classification flow and the meaning of each index are summarised in the figure below, and the result of each indicator is treated as an independent variable in the classification equation. The coefficients, which determine the relative importance of each case in the prioritisation process, were defined through regional workshops held in various cities across Minas Gerais. After normalising the results, each project in the portfolio received a score ranging from 0 to 1, and projects are categorised as High, Medium, or Low Impact.
Results
The image below provides an overview of the Short-Term PELTMG portfolio, presenting the main quantitative indicators by sector, investment type, and status.
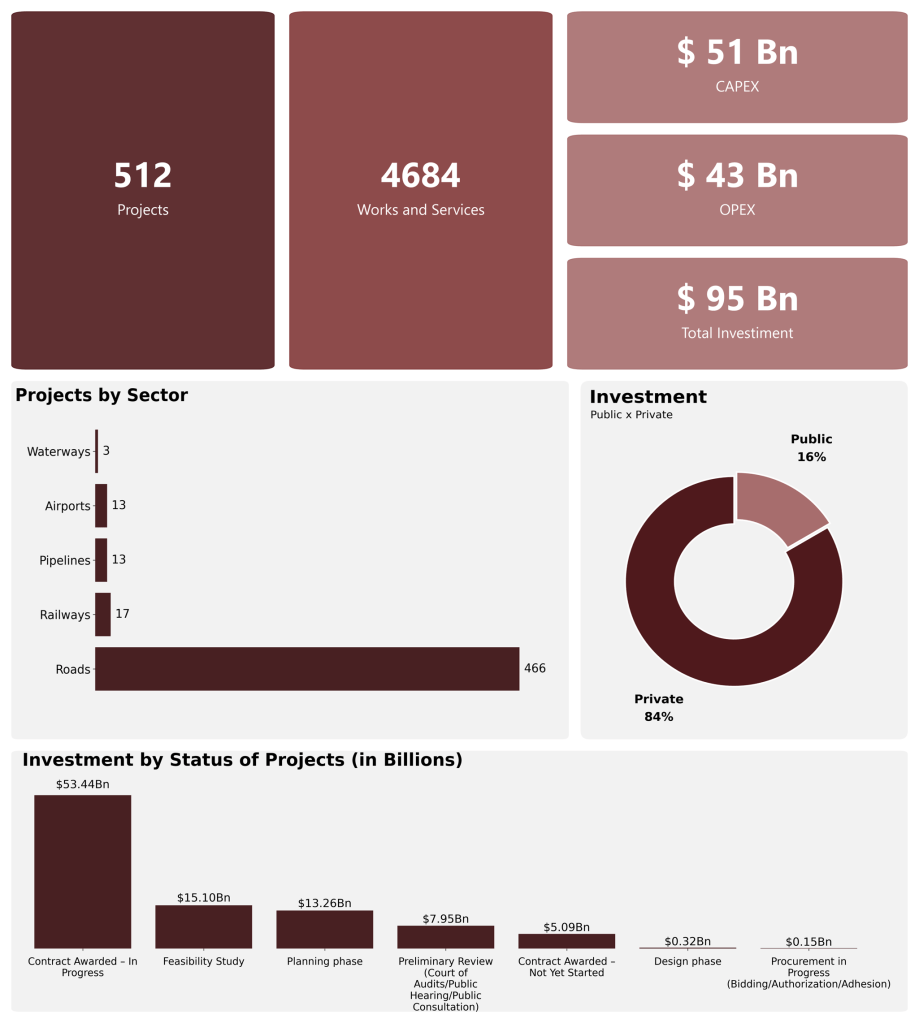
Considering the direct impacts of the projects to be prioritised, social and economic benefits exceeding $247 billion are estimated for Minas Gerais by 2055, driven by infrastructure development. Given the scale of these figures, the primary benefit of this initiative is the provision of solid, defensible, and transparent guidance for decision-makers.
Any public or private investment decision has significant implications for transport costs, travel times, emissions, and other externalities, underscoring the importance of applying robust and appropriate methods for investment prioritisation. Consequently, contracts and business arrangements arising from projects that have undergone such an evaluation and strategic planning process not only benefit from strong analytical foundations for structuring but are also more readily accepted by the market.
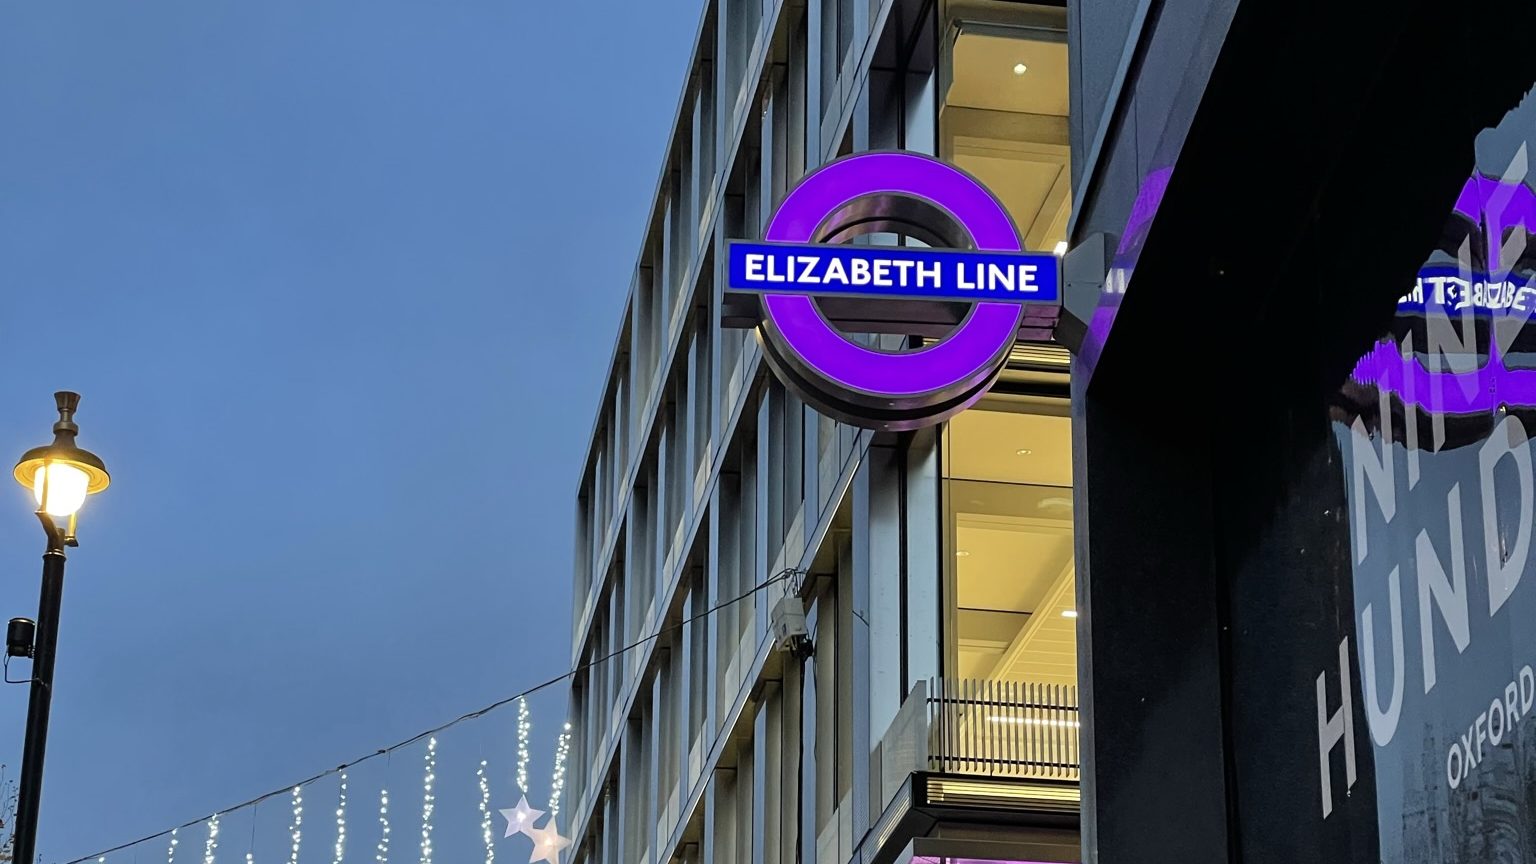
Elizabeth Line
The opening of the Elizabeth Line on 24 May 2022 could have a new impact on the London rental market. As an urban-suburban rail service running all over London to zone 9, the Elizabeth Line has a higher speed and carries 600,000 journeys each day. Therefore, this project aims to understand the Elizabeth Line’s impact on the rental housing market in London, which presents a contrastive analysis of the rental market before and after the opening of the Elizabeth Line (2020 and 2022).
Location
London(UK)
Timeline
1 month
Project Team
Felipe Almeida, Andrés Restrepo, Wendi Li, and Yiru Li
Role
Data Visualisation
Date Completed
January 2023
Language and Packages
Python, Pandas, Geopandas, Numpy, Matplotlib, Fiona, and Seaborn
Key findings
- The opening of the Elizabeth Line brings vitality to the rental market in less well-connected southeast London, with a significantly increasing rental price.
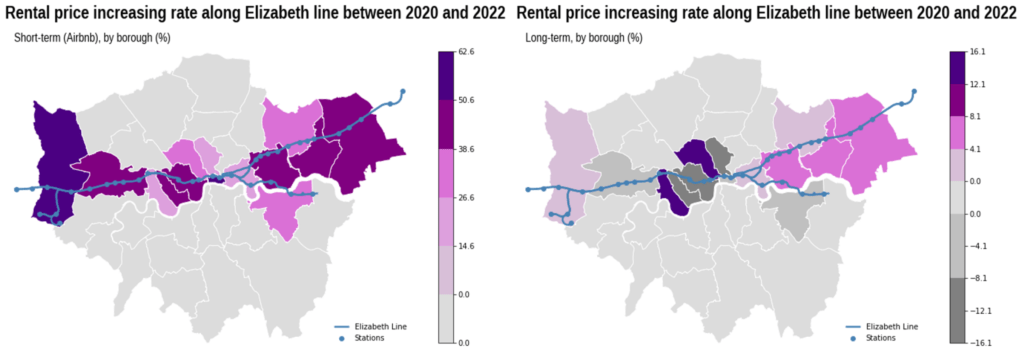
- In the 14 boroughs through which the Elizabeth line passes, there are 11 boroughs with significant price increases in the short-term rental market, but only 5 in the long-term rental market.
- Between 2020 and 2022, the short-term rental price (Airbnb) grew by 26.6%, and the long-term rental price only increased by 4.1%.
- The stations with the highest percentage increase at a 1 km radius are Hanwell, Goodmayes, Southall, Hayes & Harlington and Heathrow Central.
- The top three fare zones in London with the highest growth in median prices were Zone 5, Zone 1, and Zone 6, with increasing rates of 35%, 32%, and 31%, respectively.
- An analysis of advertised descriptions of Airbnb listings revealed that in 2020, only 14 hosts used the Elizabeth line in their house descriptions. However, by 2022, that number had increased to 270, representing an increased rate of 94.8%.
- The median price of Airbnb listings within a 1 km radius of the underground stations between 2020 and 2022 increased a 41.41%. Similarly, at 1-2 km and 2 km radius, the median price increased by 25.61% and 33.33%, respectively.
Rental Housing Market
Looking at both long-term and short-term rental markets, we could see four boroughs where the increasing rate exceeds the general in both. These are “Newham”, “Havering”, “Barking and Dagenham”, and “Camden”, and three of them are in south-eastern London. This finding shows that the Elizabeth Line has strengthened the links between southeast and central London and has given the southeast a vibrant rental market.
The Impact on Short-Term Rental Market
Stations Aproach
After calculating the median price per night at a 1 km radius from each station (Figure 2), the top 5 stations with the greater increase between 2020 and 2022 are located in zone 4, 5 and 6 of London. The top 3 stations are mono connection line stations, which means that the Elizabeth line is the only line available in those stations, in contrast to the multiple connection line stations, which have more than one line available or are connected to other transport services. The top 5 stations are: 1. Hanwell: 102.4% (Zone 4, monoline), 2. Goodmayes: 91.4% (Zone 4, monoline), 3. Southall: 90.5% (Zone 4, monoline), 4. Hayes & Harlington: 73.3% (Zone 5, multiline) and 5. Heathrow Central: 71.2% (Zone 6, multiline).

Zone Aproach
To further investigate the impact of the Elizabeth line on housing prices, another analysis was conducted based on London’s fare zones. The London transport system divides the city into different zones, each with a different fare. The zone fare data from MyLondon (London datastore) was spatially matched with the Airbnb listings by their locations. The median was used to calculate the average house prices, and the price variation between 2020 and 2022. This analysis suggests that the Elizabeth line could significantly impact short-term housing prices in London. The study of fare zones indicates that the median short-term house prices have increased significantly in areas where the Elizabeth line crosses, particularly in Zone 5.


Transport Consultancy
This report endeavours to investigate the challenge of improving sustainable access and community integration of the Hilsea Lines Greenspace from Paulsgrove. The report’s goal is to undertake a detailed analysis of transportation infrastructure’s current state, identify existing issues and possibilities, and provide feasible solutions for improving sustainable access and community integration.
Location
Portsmouth(UK)
Timeline
4 Months
Project Team
Felipe Almeida, Arundhati Sharma, and Kaihan Zhang
Role
Transport Strategist
Date Completed
April 2022

As a primarily residential area in Portsmouth, Paulsgrove features a mix of private and social housing accommodating a diverse population. Its flat terrain and range of amenities make it ideal for daily commuting and recreation. However, despite appearing self-sufficient, Paulsgrove lacks efficient connectivity to the city centre and nearby neighborhoods through public transport and active travel modes.

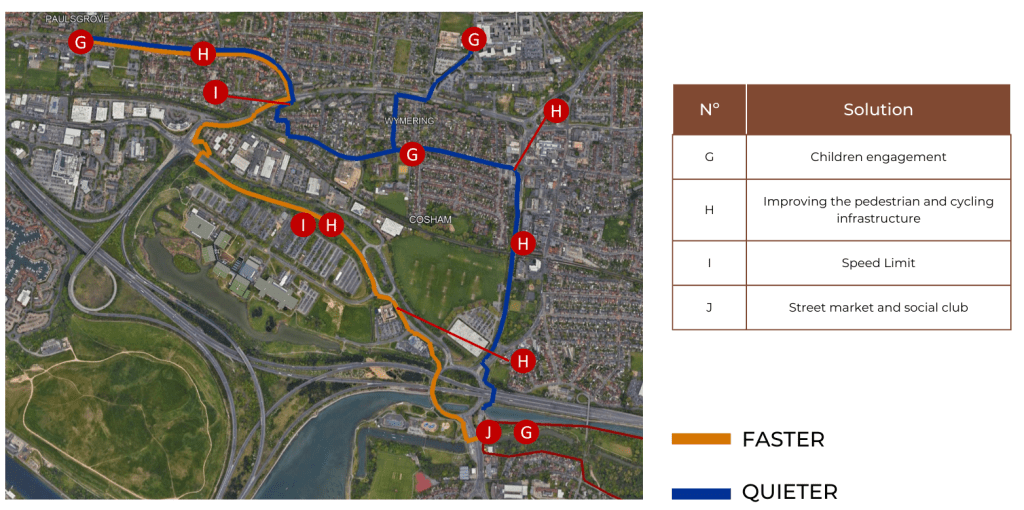
Quieter Route is designed to provide a safe and low-speed street for active travel, connecting local businesses, Cosham and the Hilsea Lines. While this route does have some street lighting, it has been noted that it may not be adequate, which could be a concern for those travelling at night. Despite this, the Quieter Route is considered the safest road for active travel, and its focus on supporting local businesses makes it an attractive option for those who want to engage with their community while commuting.
Faster Route is designed for people who need to get to work quickly and efficiently. This route is an important part of day-to-day life for many people, and it sees a lot of activity. However, safety is a concern on this route due to its high-speed street, and it is important for travellers to exercise caution while using it. The focus of this route is on improving accessibility and providing a reliable commute option for those who need to get to work or other important appointments.
Leisure Route is a great option for those who want to enjoy a more relaxed and scenic commute. This route has little to no traffic, making it a peaceful journey that allows travellers to enjoy lots of green space and interact with the natural environment. The focus of this route is on improving quality of life and providing clean air, making it an attractive option for those who prioritize a healthy lifestyle. However, it is worth noting that this route is not open on weekends as it is a private area, so it may not be a suitable option for everyone.
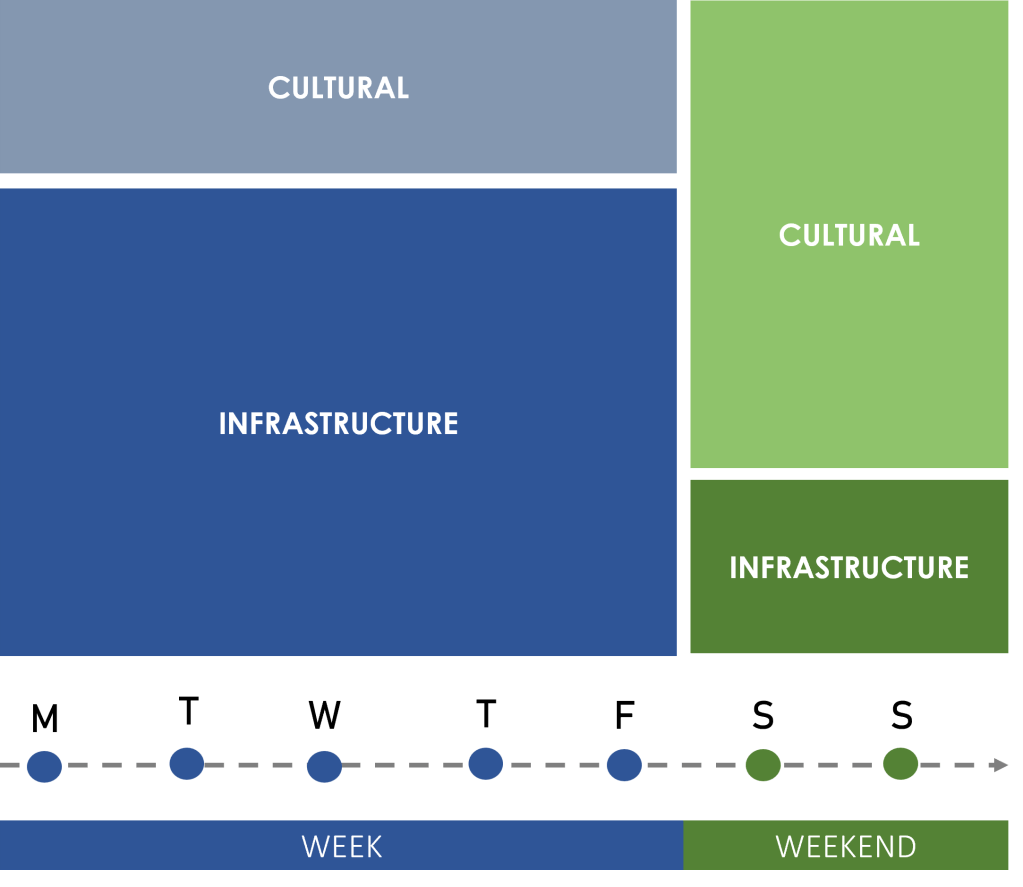
In order to address the multifaceted challenges and problems facing the Paulsgrove region, we propose a comprehensive strategy encompassing both infrastructural and cultural changes. With regards to infrastructural changes, we will focus primarily on weekdays to introduce and enhance physical infrastructure that facilitates sustainable and active modes of transport. This includes the development of dedicated cycling and walking paths, improved street lighting and traffic calming measures. However, we recognize that building a stronger sense of community requires more than just physical infrastructure. To this end, we propose a set of cultural solutions to be implemented during weekends. These solutions will aim to promote community engagement, social activities and events that strengthen bonds between residents, encourage inclusivity and improve the overall quality of life.
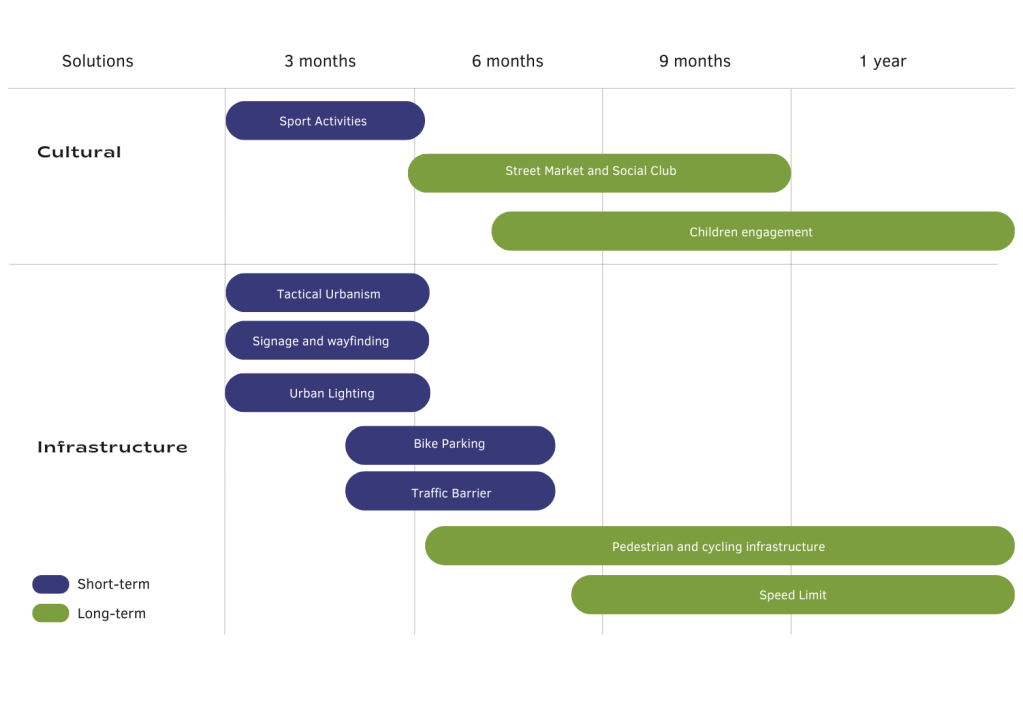

Long-term proposals
The Leisure Route is not included as part of the proposed solution package due to its private status and weekend closure. As a result, the proposed solutions focus on the Quieter and Faster Routes, which offer distinct advantages and challenges for active travel and daily commuting. Thus, the four long-term solutions are distributed according to the social, environmental, and urban context of each route, providing crucial elements to increase active travel in those areas .
Children Engagement


The proposal is to create two types of cycling activities: the bike bus for weekdays and the cycling routes for kids on weekends because there is more availability of parents to engage in this activity and promote it as a special day. Therefore, four main schools in the northwest region were identified to be selected for the first implementation round. France and Portugal have the same dynamic, connect the student’s home to Schools. However, the proposal is to bring a new approach: if the schools were the connection between student’s and Hilsea Lines? As a leisure activity to teach kids about the importance of natural resources, the connection with natural environment aims to build new perspective for Portsmouth future.


London Mobility Flows
This study aims to compare and evaluate the performance of two models, namely the Deep Gravity Model and the Production-constrained Model, concerning their ability to predict mobility patterns in London. A comprehensive understanding of their efficacy and applicability is established by comparing the outcomes of these models against observed flow patterns. The study specifically concentrates on the London region, containing its diverse cultural, economic, and infrastructural facets
Location
London(UK)
Timeline
4 Months
Project Team
Felipe Almeida
Role
Data Processing, Data Cleaning, Data Analysis and Data Visualisation
Date Completed
September 2022
Language and Packages
Python, Pandas, GeoPandas, Seaborn, Matplotlib, Folium, Numpy, H3, Area, Fiona, and Pytorch

Mobility flows are complex, and people have various reasons for their travels, such as going to their jobs or schools. These routines usually happen on weekdays, creating a clear pattern that we can represent with a linear relationship with people’s origin and destination flows. However, not all travel fits this pattern. The citizens also commute for leisure, sports, healthcare, and other reasons that do not follow a predictable schedule. Thus, we need different tools to handle the irregularity to grasp these more complex movements. One promising tool is neural networking, which can better comprehend and predict these intricate movements with a non-linear relationship analysis.
Methodology

This study relies on three primary datasets: Locomizer, Point of Interest, and Census 2021. Locomizer serves as the central component of the analysis, with the aggregated origin and destination flow for London within hexagons as geographic area units. The hexagon ID serves as the primary index, and 3.2. Data 25 to ensure coherence, the remaining datasets are incorporated into this index via an area-weighted spatial join.
The dataset applied in this study contains aggregated data at level 9, with each dataset file including more than 4 million rows. The careful cleaning of this dataset emerged as an essential requirement to ensure the integrity of subsequent analyses. Hexagons play a key role in understanding spatial relationships, particularly mobility flows. Despite the computational limitation of running the spatial interaction model to deal with a high amount of data, it required a transition from hexagonal level 9 to level 7. This transformation was facilitated through the H3 package in Python. At level 9, a hexagon has a relatively small area, approximately 0.10 square kilometres. In contrast, at level 7, a hexagon covers a significantly larger area, approximately 5.16 square kilometres.


Hexagons at level 7 in London have 415 hexagons, resulting in 172,225 possible origin and destination flow combinations. Consequently, the dataset concerning work and workflows displays a distinct distribution. This distinction arises because workflows constitute only a fraction of the overall flow. As a result, this dataset showcases both a reduced maximum value and a lower mean value. This value difference leads to a more balanced workflow data distribution, as the accompanying graph shows. Furthermore, the distance from the mean (standard deviation) is notably smaller. Therefore, the values shown in the graphs are presented in logarithmic scale to accommodate the dataset’s extensive size and prevent value distortion.
Results
The map illustrates the spatial distribution of Points of Interest (POI) in London, categorising them into work-related and non-workrelated. It becomes evident that their distribution across the city exhibits a degree of similarity, predominantly concentrating in inner London instead of outer London. However, it is worth emphasising that the total number of points differs significantly due to the non-work category that contains four distinct POI groups. The POI values for non-work are also correlated with mobility flow values distribution, as the proportions remain consistent.


Examining the workflows illustrated on the left in red, it becomes apparent that both models exhibit a similar pattern of flow concentration in central London. However, there is a significant distinction: the SIM model tends to overestimate some of the flows, with disparities varying from 0.15 to 0.30 compared to the Observed Flows. In contrast, the DG model’s flow estimations closely align with the distribution of the Observed Flows, reinforcing the significance of its low RMSE value.
Shifting our focus to the non-work flows shown on the right in blue, we observe a different outcome. At this level 7 of Uber hexagons, the Spatial Interaction Model displays greater accuracy in estimating non-work flow data, consistent with its previously noted low RMSE value. In contrast, the Deep Gravity Model tends to overestimate the flows, with disparities ranging between 0.5 and 0.6 compared to the Observed Flows. These spatial insights 4.3. Discussion 51 further illustrate both models’ nuanced performance characteristics regarding their strengths and limitations in different flow scenarios.

Attractiveness factor
The attractiveness factor utilised in the Spatial Interaction Model for Work and Non-workflows was constructed based on the categories within the POI dataset. In the context of Workflows,the analysis revealed that Public Infrastructure(PI), Transport(TR), and Education and Health (EH) emerged as the most significant variables in the data collected from Mobility Data.In contrast,for the Non-work attractiveness factor,the primary variables align with those of the Workflows, except for Retail(RT).
